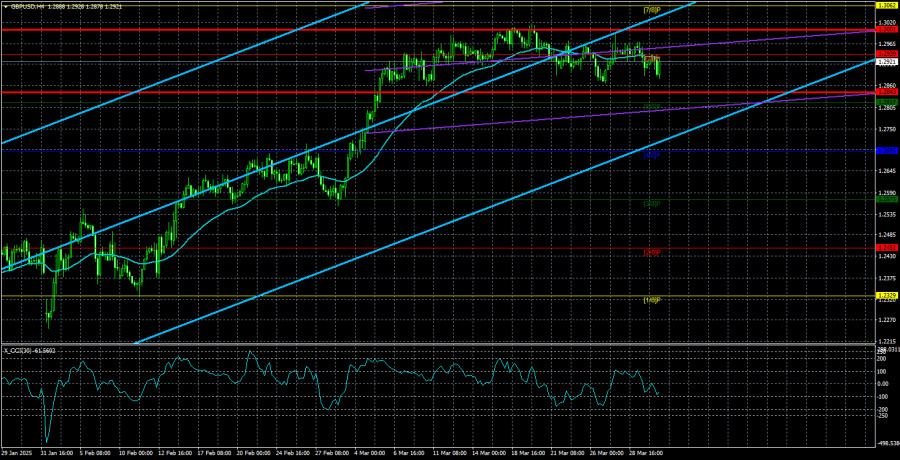
The GBP/USD currency pair continues to trade in a flat range. On the 4-hour timeframe, this is a classic flat; on the lower timeframes, it looks more like a "swing." Tuesday brought no significant changes to the market. Naturally, some movement occurred during the day simply because the UK and the U.S. released macroeconomic reports. Additionally, the market is anticipating new tariffs from Donald Trump. However, none of this changes the fact that the pound has traded sideways for nearly a month.
It's also worth noting that the pound hasn't even attempted a downward correction after its strong rally. We understand that Trump's tariff policy implies serious shifts in the global economy, and the dollar, as "Trump's currency," is currently out of favor among traders. However, it's important to point out that expectations don't always align with reality. In other words, the U.S. economy hasn't started slowing down, and Trump hasn't yet implemented all of his planned tariffs or heard the responses from all his trade partners — yet the market has already priced in the worst-case scenario for the U.S. economy. Naturally, that scenario is a recession — one even the Federal Reserve does not believe in. However, traders don't care about the Fed's opinion; they follow the narratives that tell them to sell the dollar.
The British pound has its reasons for holding ground against the dollar. During the latest Bank of England meeting, it became clear that the British central bank is not in a hurry to cut the key interest rate — even though at the beginning of the year, there was widespread expectation of four rounds of easing in 2025. However, inflation in the UK continues to rise, forcing the BoE to act more cautiously. Then again, the Fed also doesn't plan to cut rates — and might even abandon easing altogether in 2025.
Still, none of this changes the fact that the dollar refuses to rise even when there are valid reasons for it. And if it does rise, it's weak and sluggish. In any case, that growth occurs within the boundaries of a flat market.
As we've already mentioned, plenty of important events are lined up this week, and April 2 (today) is one of the key days. So, there's a sense that the market may "explode," and we could see a breakout. But at the same time, we would prefer to see a downward movement, as the technical picture on higher timeframes completely contradicts trader behavior. The market continues to respond only to one factor — Trump's trade wars. Even on the 4-hour chart, the technical picture isn't much better: we still see a flat range. Therefore, trading in either direction is highly questionable. In short, it's a complex and ambiguous situation — as expected when Trump is president.

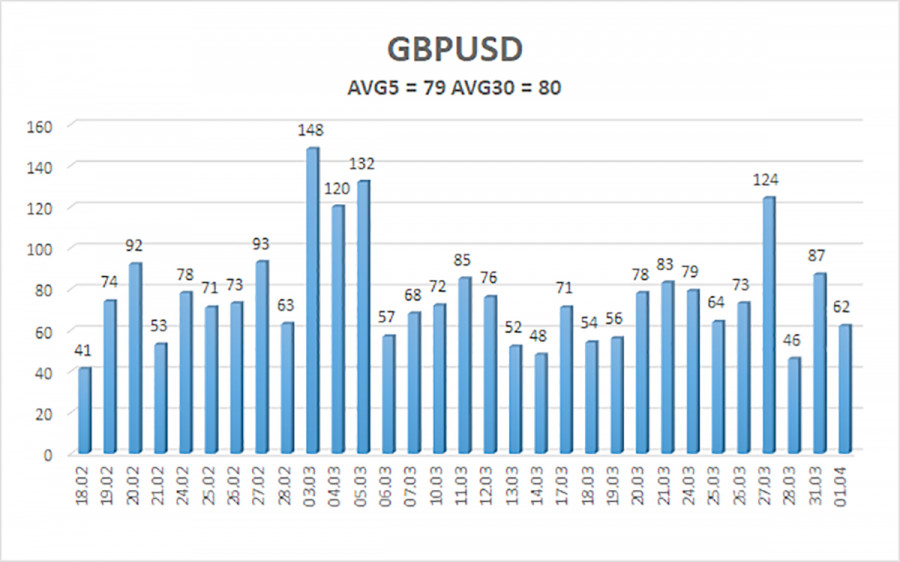
The average volatility of the GBP/USD pair over the last five trading days is 79 pips, which is considered "average" for this currency pair. On Tuesday, April 2, we expect the pair to trade within a range limited by 1.2843 and 1.3001. The long-term regression channel has turned upward, but the downtrend remains intact on the daily timeframe. The CCI indicator has not recently entered overbought or oversold territory.
Nearest Support Levels:
S1: 1.2817
S2: 1.2695
S3: 1.2573
Nearest Resistance Levels:
R1: 1.2939
R2: 1.3062
R3: 1.3184
Trading Recommendations:
The GBP/USD pair continues to follow a medium-term downtrend, while the 4-hour chart shows a very weak correction that could end at any moment, as the market still refuses to buy the dollar. We still do not recommend long positions, as we believe the current upward movement is simply a daily timeframe correction that has already become technically illogical.
However, if you trade purely on technical signals, long positions are still valid with targets at 1.3001 and 1.3062—though keep in mind that the market is flat regardless. Sell orders remain attractive, targeting 1.2207 and 1.2146 since the daily timeframe's upward correction will eventually end (assuming the downtrend hasn't ended by then). The British pound appears extremely overbought and unjustifiably expensive, but it's difficult to predict how long the dollar's "Trump-driven" decline will continue.
Explanation of Illustrations:
Linear Regression Channels help determine the current trend. If both channels are aligned, it indicates a strong trend.
Moving Average Line (settings: 20,0, smoothed) defines the short-term trend and guides the trading direction.
Murray Levels act as target levels for movements and corrections.
Volatility Levels (red lines) represent the likely price range for the pair over the next 24 hours based on current volatility readings.
CCI Indicator: If it enters the oversold region (below -250) or overbought region (above +250), it signals an impending trend reversal in the opposite direction.


