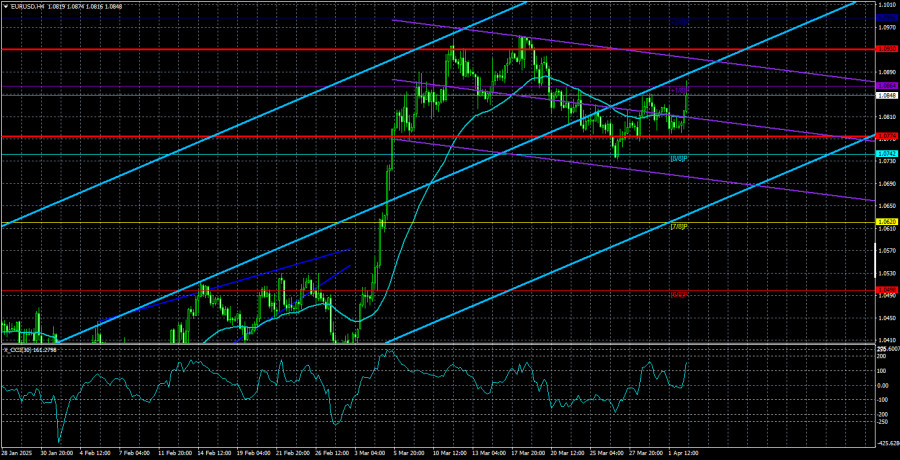
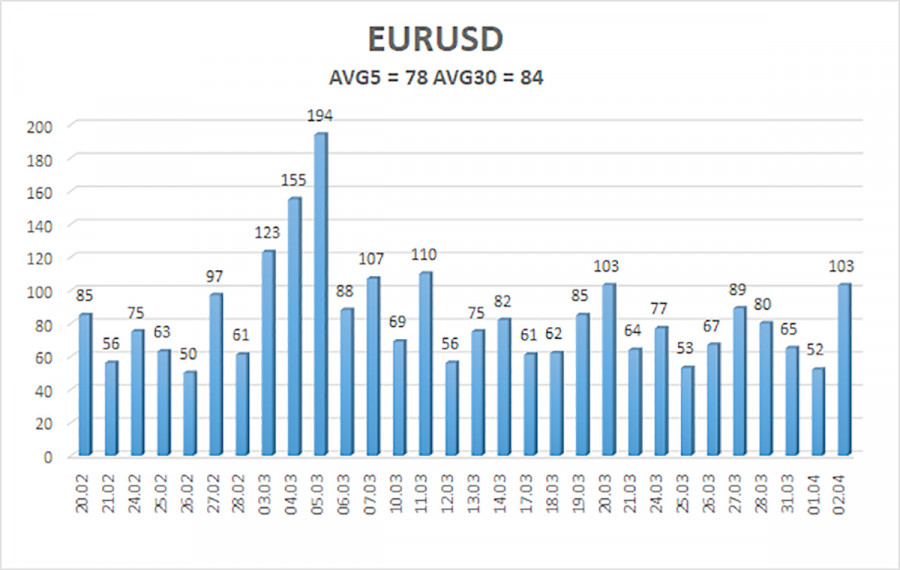
The EUR/USD currency pair once again spent most of Wednesday virtually motionless. Even in the chart below, it's clear that recent volatility is low and decreasing. Strangely enough, this is happening when the dollar should, at first glance, be plummeting. Recently, the market has shown no urgency to abandon the U.S. dollar. For those who may have forgotten, the U.S. dollar has been gaining against the euro for 16 years, clearly visible in the monthly timeframe. As mentioned, breaking such a strong trend requires more serious reasons than Trump's tariffs. Moreover, a new downtrend on the daily timeframe began six months ago, and the current euro growth—no matter how strong it may seem—is merely a correction within that broader downtrend.
Let's look at how substantial and sustained the dollar's decline has been. The bulk of the dollar's fall happened over three days—March 3, 4, and 5—when it dropped by 400 pips. Excluding that "storm," the dollar declined by 360 pips over three months of correction, compared to a 1,040-pip rally. The first conclusion is clear: we wouldn't have seen such a sharp correction if not for Trump's tariffs.
We can also question how justified the dollar's decline was. Undoubtedly, Trump's tariffs will negatively affect the U.S. economy. But they will also hit the European, British, and global economies. So, what exactly are traders worried about? The U.S. economy continues to grow steadily at 2–3% per quarter. The European economy, on the other hand, grows by 0.1–0.3% at best. If Europe slows down, that's a recession. If the U.S. slows down, it's likely just stagnation.
So, while the market has reacted to Trump's aggressive and protectionist actions, what justification remains for further dollar selling? Let's also not forget that the European Central Bank has been cutting rates at every meeting since last summer. The Federal Reserve has only cut rates four times and may pause in 2025. That's a realistic scenario because Trump's actions will likely fuel inflation globally. Inflation in the EU is at 2.2%, while in the U.S., it's 2.8%. Therefore, a basic analysis shows that the ECB may continue easing monetary policy, while the Fed must keep rates steady to avoid another inflation surge—which could only be tackled by raising rates again. But how can rates be raised if the economy is expected to slow down in the coming year?
We still believe the dollar has a higher chance of strengthening in 2025, while the euro lacks a solid foundation for a long-term uptrend.
The average volatility of the EUR/USD currency pair over the last five trading days (as of April 3) is 78 pips, which is considered "moderate." We expect the pair to trade between 1.0774 and 1.0930 on Thursday. The long-term regression channel has turned upward, but the broader downtrend remains intact, as seen in higher timeframes. The CCI indicator has not recently entered overbought or oversold territory.
Nearest Support Levels:
S1 – 1.0742
S2 – 1.0620
S3 – 1.0498
Nearest Resistance Levels:
R1 – 1.0864
R2 – 1.0986
Trading Recommendations:
The EUR/USD pair continues to correct. We've been stating that we expect a medium-term decline in the euro for months, and that view remains unchanged. The dollar still has no solid reasons for a medium-term decline—except for Donald Trump. However, Trump alone may be enough to pressure the dollar, especially since most other factors are ignored. Short positions remain much more attractive, with targets at 1.0315 and 1.0254, though it's currently hard to determine whether the Trump-fueled rally has ended. If you trade based solely on technicals, long positions can be considered if the price remains above the moving average, with targets at 1.0864 and 1.0930.
Explanation of Illustrations:
Linear Regression Channels help determine the current trend. If both channels are aligned, it indicates a strong trend.
Moving Average Line (settings: 20,0, smoothed) defines the short-term trend and guides the trading direction.
Murray Levels act as target levels for movements and corrections.
Volatility Levels (red lines) represent the likely price range for the pair over the next 24 hours based on current volatility readings.
CCI Indicator: If it enters the oversold region (below -250) or overbought region (above +250), it signals an impending trend reversal in the opposite direction.


