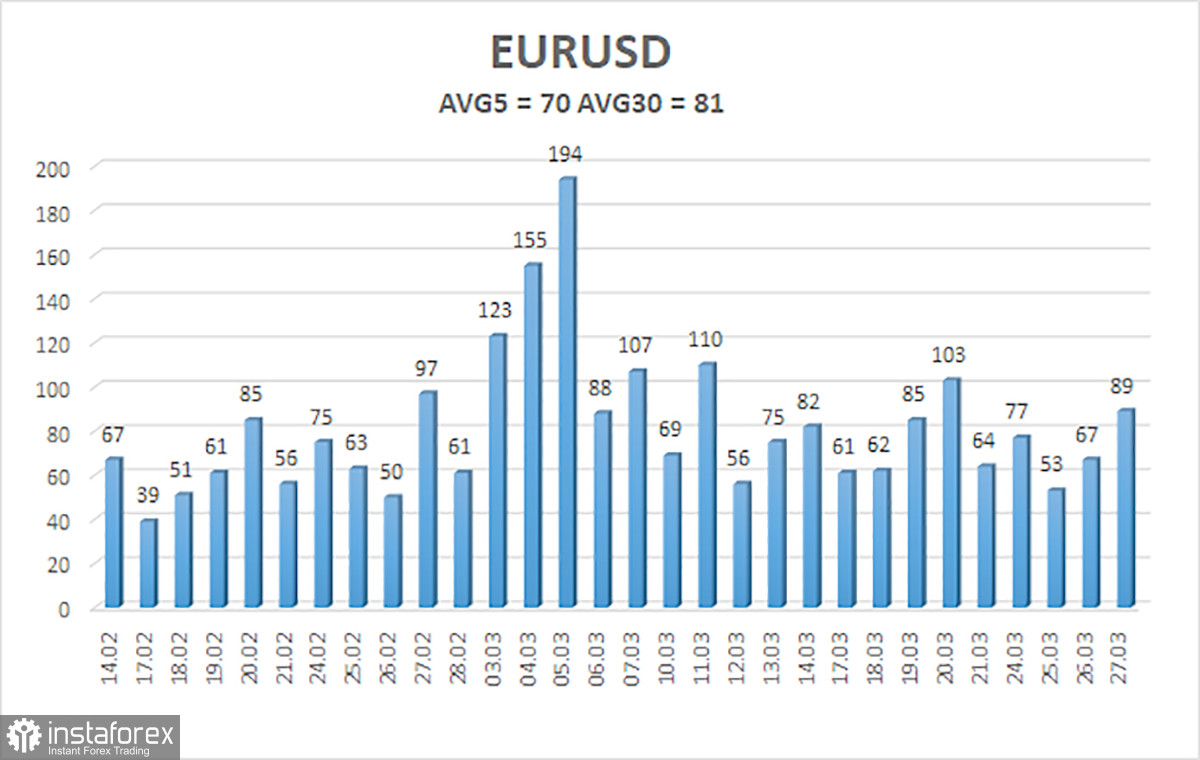
The EUR/USD currency pair maintained its downward bias on Thursday, although it traded higher throughout the day. Volatility remained low once again, indicating weak market activity. However, traders had enough reasons to be more active for the second consecutive day. On Wednesday, significant reports were published on UK inflation and U.S. durable goods orders, which were quite impactful. Yet volatility only reached 35 pips that day.
On Thursday, the situation in the forex market became even more interesting, as Donald Trump didn't wait for "America's Liberation Day" and imposed tariffs on all imported cars. The dollar, as expected, depreciated. But once again, there was no sense that the market was genuinely concerned. The market actively sold off the dollar for only three days in reaction to Trump's sanctions and tariffs. From March 3 to 5, the dollar lost 400 pips—accounting for most of the corrective upswing that has lasted nearly three months. Since then, we've seen no strong moves or steep dollar declines.
We still believe the current upward movement is a corrective trend, and the market is gradually showing signs that it's tired of Trump's antics. It now seems to react only to actual deterioration in conditions. Most experts believe that Trump's tariffs will not cause a severe economic downturn. Of course, this is debatable, as the tariffs are significant, and the retaliatory measures are equally strong. We believe the U.S. economy will slow considerably—but not enter a recession.
Even during ultra-high Federal Reserve interest rates, the U.S. economy avoided recession—it didn't even come close to one. Therefore, Trump's tariffs—meant to improve the economy in the medium term—shouldn't have serious consequences.
The real damage may come from other developments Trump seems to overlook. Across the globe, there are nearly open campaigns promoting a "Don't Buy American" stance. How else should Europeans respond when Trump wants to impose draconian tariffs on them? Or the Danes after he tried to take Greenland? Or are the Canadians already hit by tariffs and being "invited" to become part of America? Or the Chinese, now entering the second round of a full-scale trade war? Many people choose not to buy American products—even without being forced.
Naturally, not everyone, and not in every country, is affected by this, but it's still a significant blow to the economy. However, it's the only real blow. In all other respects, the U.S. economy and the Fed's monetary policy appear strong enough for the dollar to stop falling. The market has already priced in Trump's tariffs—so how much longer can the dollar keep falling based on this single factor?
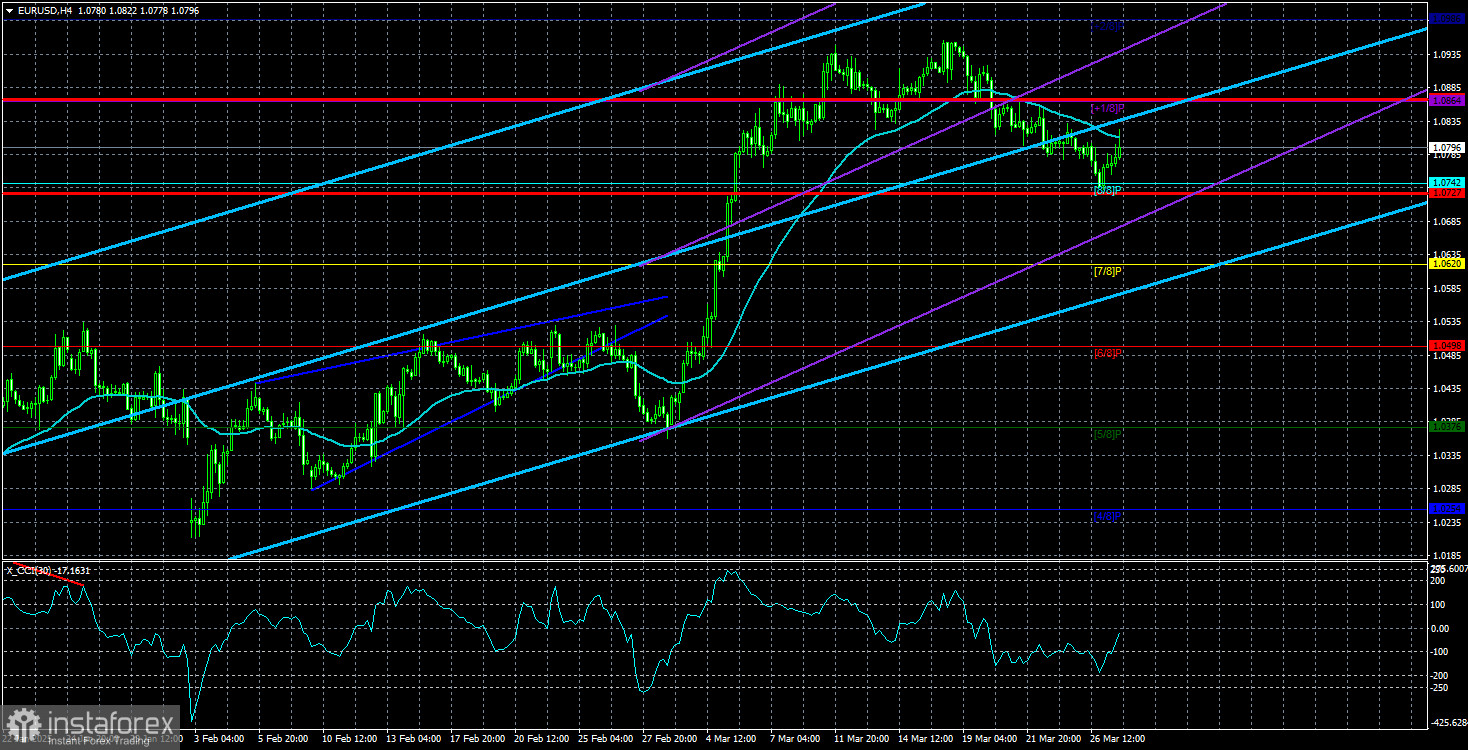
The average volatility of the EUR/USD currency pair over the last five trading days (as of March 28) is 70 pips, which is considered "moderate." We expect the pair to trade between 1.0727 and 1.0867 on Friday. The long-term regression channel has turned upward, but the broader downtrend remains intact, as seen in higher timeframes. The CCI indicator has not recently entered overbought or oversold territory.
Nearest Support Levels:
S1 – 1.0742
S2 – 1.0620
S3 – 1.0498
Nearest Resistance Levels:
R1 – 1.0864
R2 – 1.0986
Trading Recommendations:
The EUR/USD pair continues its weak downward correction. For the past few months, we've consistently forecast a medium-term decline in the euro, and nothing has changed in that outlook. The dollar still has no real reason for a medium-term fall apart from Donald Trump. Short positions remain far more appealing, with targets at 1.0315 and 1.0254, although it's difficult to say when this illogical upward movement will end. If you trade purely on technicals, long positions can be considered if the price moves above the moving average, targeting 1.0986.
Explanation of Illustrations:
Linear Regression Channels help determine the current trend. If both channels are aligned, it indicates a strong trend.
Moving Average Line (settings: 20,0, smoothed) defines the short-term trend and guides the trading direction.
Murray Levels act as target levels for movements and corrections.
Volatility Levels (red lines) represent the likely price range for the pair over the next 24 hours based on current volatility readings.
CCI Indicator: If it enters the oversold region (below -250) or overbought region (above +250), it signals an impending trend reversal in the opposite direction.