The GBP/USD currency pair traded higher again on Thursday, even though a semblance of a downward correction had begun just a few days earlier. The market had already digested the weak UK inflation report and strong U.S. durable goods data. But what can you do when Trump announces new tariffs the next day and the dollar falls again? As a result, we still don't see even a hint of a proper correction—only a mild pullback.
It's worth recalling that the British pound has shown remarkable resilience against the dollar for the past two years. Perhaps it had fallen for 16 consecutive years and lost nearly half its value. Or maybe the market sees potential in the UK economy under the new Labour government. One way or another, the pound depreciates less frequently than the euro and tends to gain more.
Over the past couple of months, the Bank of England's monetary policy can somewhat explain this phenomenon—or at least an attempt can be made. At the end of last year, Andrew Bailey said he expected a 100-basis-point rate cut in 2025. However, at the start of 2025, inflation in the UK began to rise, and the market quickly concluded that the actual amount of easing would be less. The BoE confirmed this hypothesis at its most recent meeting, asking markets not to expect a rate cut any time soon. Traders quickly priced in just two rate cuts from the BoE—similar to the Fed's outlook.
Consequently, the recent rise of the pound is not surprising. However, what about the broader trend and the numerous bullish dollar factors the market seems to overlook?
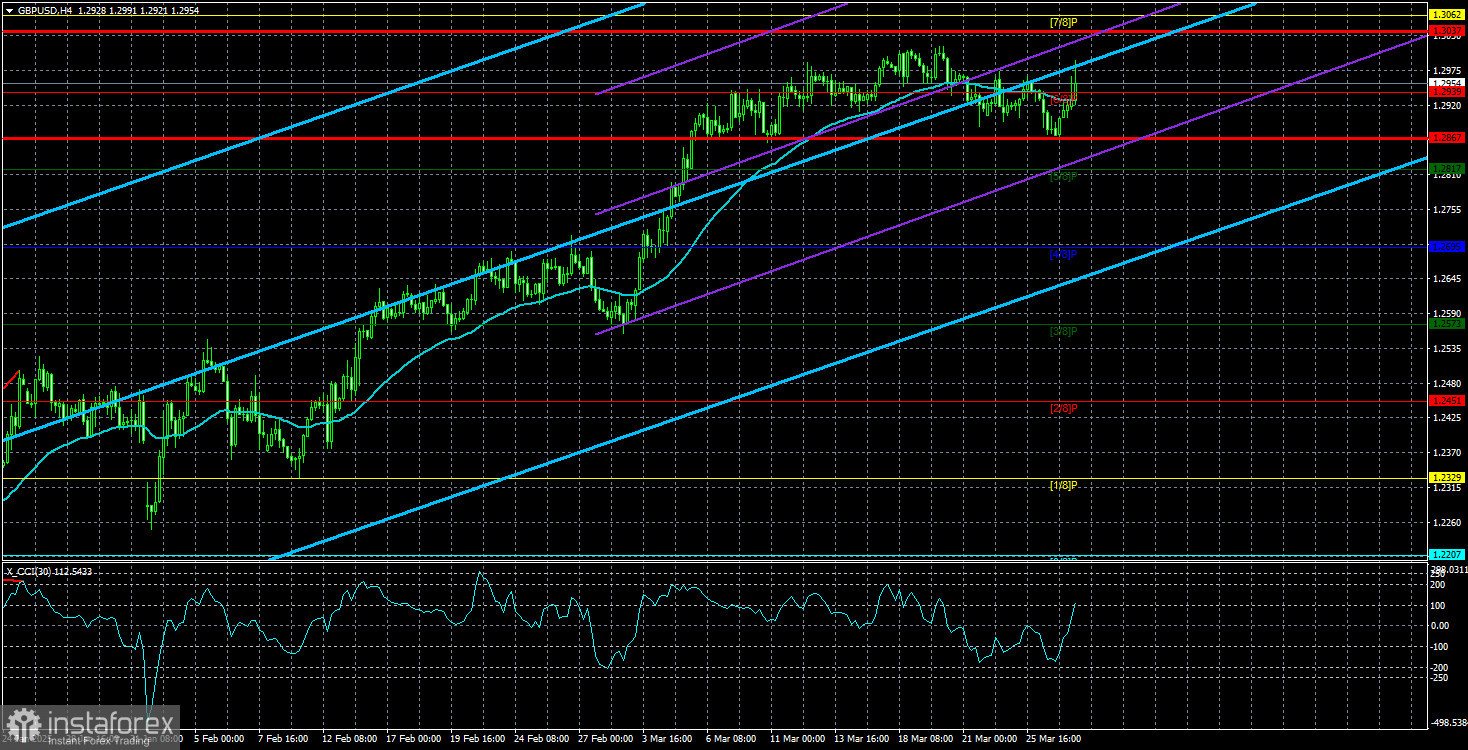
Technically, the situation remains quite unclear. We have a clear long-term downtrend that has persisted for 16 years on the monthly timeframe. On the daily timeframe, the downtrend has continued for six months. However, in the 4-hour timeframe, there has been an uptrend that has lasted for three months. One might assume that global trends are reversing, but that would require continued long-term growth in the pound. And on what fundamental basis could the pound grow for another year, two, or three? Given the weakness of the UK economy, we don't currently see such factors.
Trump may continue dragging the dollar down on his own, but the market has begun to show that it's no longer willing to sell off the dollar so readily after every tariff announcement. The overall situation is still very uncertain and unusual.
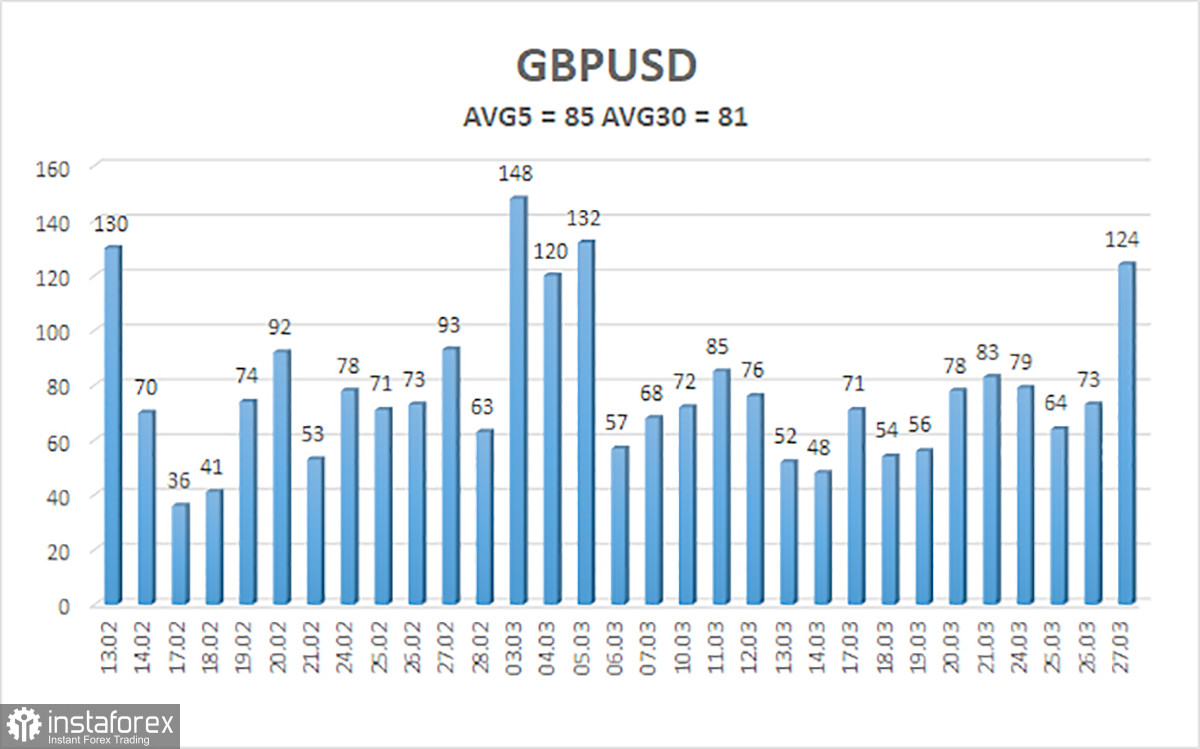
The average volatility of the GBP/USD pair over the last five trading days is 85 pips, which is considered "average" for this currency pair. On Friday, March 28, we expect the pair to trade within a range bounded by the levels of 1.2867 and 1.3037. The long-term regression channel has turned upward, but the downtrend remains intact on the daily timeframe. The CCI indicator has not recently entered overbought or oversold territory.
Nearest Support Levels:
S1 – 1.2939
S2 – 1.2817
S3 – 1.2695
Nearest Resistance Levels:
R1 – 1.3062
R2 – 1.3184
R3 – 1.3306
Trading Recommendations:
The GBP/USD pair maintains a medium-term downward trend while a weak correction continues on the 4-hour chart. This correction could end anytime, as the market still refuses to buy the dollar. We continue to avoid long positions, as the current upward movement appears to be a daily correction that has grown into an illogical rally. However, if you trade purely on technical signals, long positions are currently valid with targets at 1.3037 and 1.3062, provided the price remains above the moving average. Sell orders remain attractive with targets at 1.2207 and 1.2146 since, sooner or later, the upward correction on the daily chart will end (assuming the broader downtrend doesn't end first). The pound remains extremely overbought and unjustifiably expensive, and Donald Trump won't be able to devalue the dollar indefinitely. However, it is very difficult to predict how long the dollar will continue to fall due to the "Trump risk."
Explanation of Illustrations:
Linear Regression Channels help determine the current trend. If both channels are aligned, it indicates a strong trend.
Moving Average Line (settings: 20,0, smoothed) defines the short-term trend and guides the trading direction.
Murray Levels act as target levels for movements and corrections.
Volatility Levels (red lines) represent the likely price range for the pair over the next 24 hours based on current volatility readings.
CCI Indicator: If it enters the oversold region (below -250) or overbought region (above +250), it signals an impending trend reversal in the opposite direction.