The EUR/USD currency pair continued its upward movement on Monday. Despite the slower growth this time, the pair continues to rise. Yesterday saw a 50-pip increase; today, it's 250. What else could be expected on a Monday when the fundamental backdrop remained unchanged over the weekend? Some analysts occasionally try to find reasons for optimism, but this only causes us bewilderment.
What reasons for optimism exist at this moment? Donald Trump introduced a "grace period" for 75 countries? And during this period, will a 10% tariff apply to everyone? That's what we're calling a "grace period"? Furthermore, sanctions introduced before April 2 are still in place. This means that steel, aluminum, and automobile imports into the U.S. are still subject to duties. Of the 75 countries on the list, only a few had tariffs higher than 10%. What benefits or concessions has Trump offered? For a few countries with which the U.S. has minimal trade? And based on that, is the U.S. dollar supposed to mount a serious rally?
Remember that "fundamental backdrop" now refers solely to Trump's trade war. Of course, other macroeconomic events exist, but the market ignores them. So even if the European Central Bank cuts rates to zero tomorrow, we're unlikely to see a significant drop in the euro. The monetary policy factor, which used to govern currency markets for two years, currently holds no weight.
We should also add that traders are no longer interested in trade disputes with Israel, Serbia, or Lesotho. The market is focused on the trade wars with the EU and China. The situation with the European Union is highly unclear — even though Ursula von der Leyen announced a suspension of the latest tariff package in response to a similar move by Trump. But once again, all previous tariffs remain in place. No official negotiations are taking place, or at least, no concrete information has emerged.
The situation with China is even more severe. We're now at "145% vs. 125%," — and most analysts agree this has become a meaningless tit-for-tat. Tariffs can be raised indefinitely — they're just numbers on paper. Much of the trade flow will be wiped out once tariffs reach 50–70% because products will become uncompetitive compared to other countries. In any case, there is no talk of de-escalation or negotiations with China either. So, we see no reasons for optimism, cheer, or a U.S. dollar rally.
Of course, the dollar won't keep falling forever. A correction will begin sooner or later. But when? It's impossible to tell — even using technical indicators.
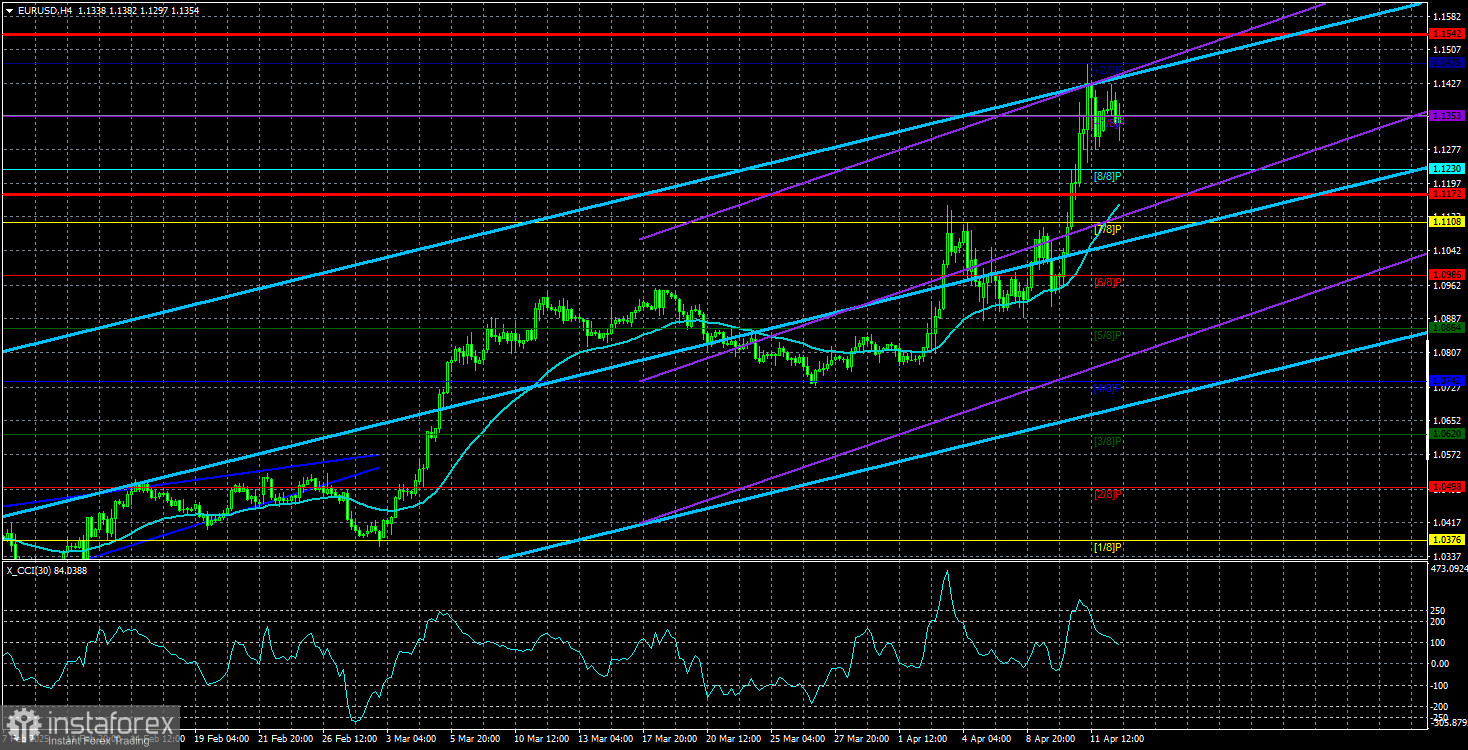
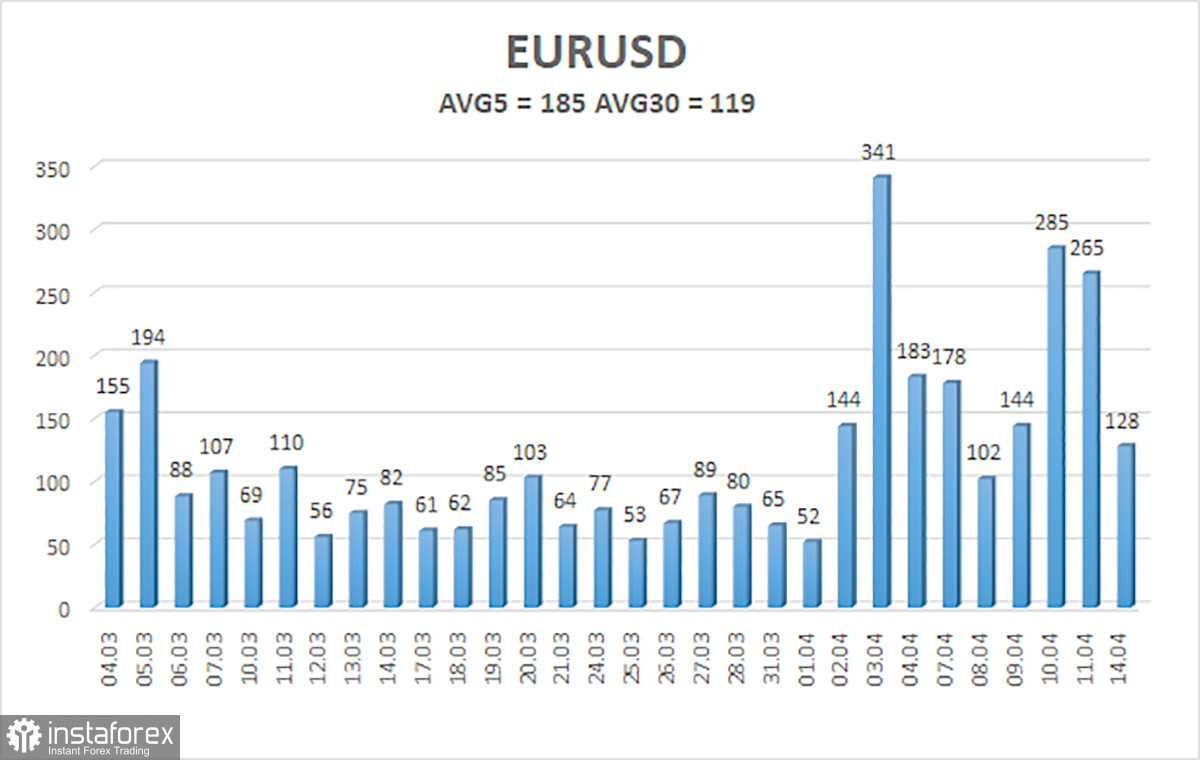
The average volatility of the EUR/USD pair over the last five trading days as of April 15 is 185 pips, which is classified as "high." We expect the pair to trade between 1.1172 and 1.1542 on Tuesday. The long-term regression channel is pointing upward, indicating a short-term bullish trend. The CCI indicator has entered the overbought zone for the second time, which again warns of a possible correction. A bearish divergence has also formed. However, since Trump isn't backing down, the dollar could continue to decline.
Nearest Support Levels:
S1 – 1.1230
S2 – 1.1108
S3 – 1.0986
Nearest Resistance Levels:
R1 – 1.1353
R2 – 1.1475
Trading Recommendations:
EUR/USD maintains a bullish trend. For several months, we've consistently stated that we expect the euro to decline in the medium term — and nothing has changed in that outlook. The dollar still has no fundamental reason for a medium-term drop — except for Trump. Yet that one reason continues to drag the dollar deeper into the abyss.
Moreover, it's entirely unclear what economic consequences this one factor will bring. It may well happen that by the time Trump stops escalating, the U.S. economy will already be in a dire state — and any potential dollar rebound will no longer be relevant.
If you're trading based purely on technicals or reacting to "Trump factor" news, then long positions can still be considered as long as the price remains above the moving average, with targets at 1.1475 and 1.1542.
Explanation of Illustrations:
Linear Regression Channels help determine the current trend. If both channels are aligned, it indicates a strong trend.
Moving Average Line (settings: 20,0, smoothed) defines the short-term trend and guides the trading direction.
Murray Levels act as target levels for movements and corrections.
Volatility Levels (red lines) represent the likely price range for the pair over the next 24 hours based on current volatility readings.
CCI Indicator: If it enters the oversold region (below -250) or overbought region (above +250), it signals an impending trend reversal in the opposite direction.