Analysis of Wednesday's Trades
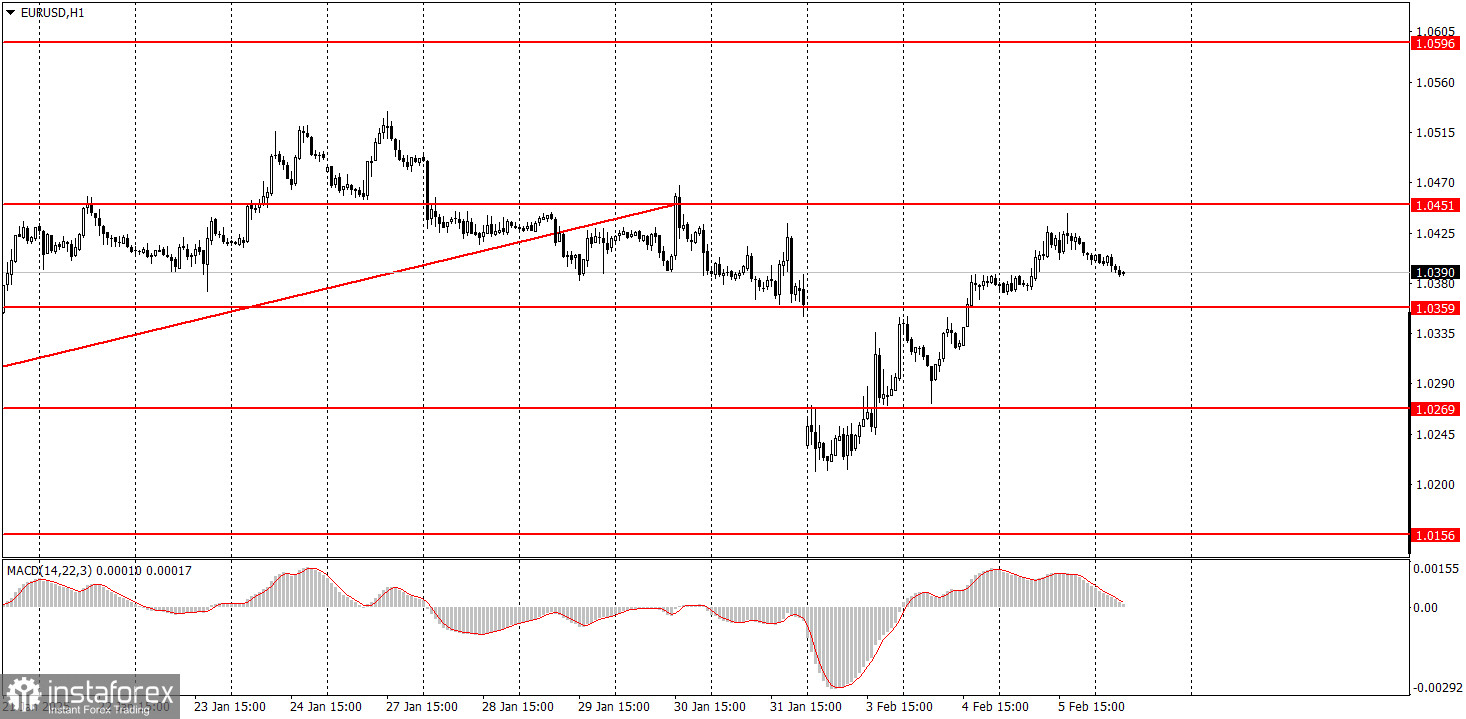
1H Chart of EUR/USD
The EUR/USD currency pair continued its upward movement on Wednesday, which directly contradicted the local macroeconomic background. Let's revisit the key points we've been emphasizing. First, the price is currently undergoing a correction on the daily timeframe, and on the hourly timeframe, this correction can appear as a series of trends. Second, the global fundamental background still supports the U.S. dollar. The dollar isn't rising at the moment simply because it requires a correction. Thus, on Wednesday, the market overlooked the local macroeconomic data, but the movement remains logical in the medium term. The services PMI indices from Germany and the Eurozone did not report figures that would justify the euro's rise during the first half of the day; nevertheless, the euro appreciated. The U.S. ISM Services PMI showed weak results, yet the dollar barely moved in the latter half of the day. The ADP employment report indicated better-than-expected results, but again, the dollar did not react. Overall, local movements appear illogical and erratic.
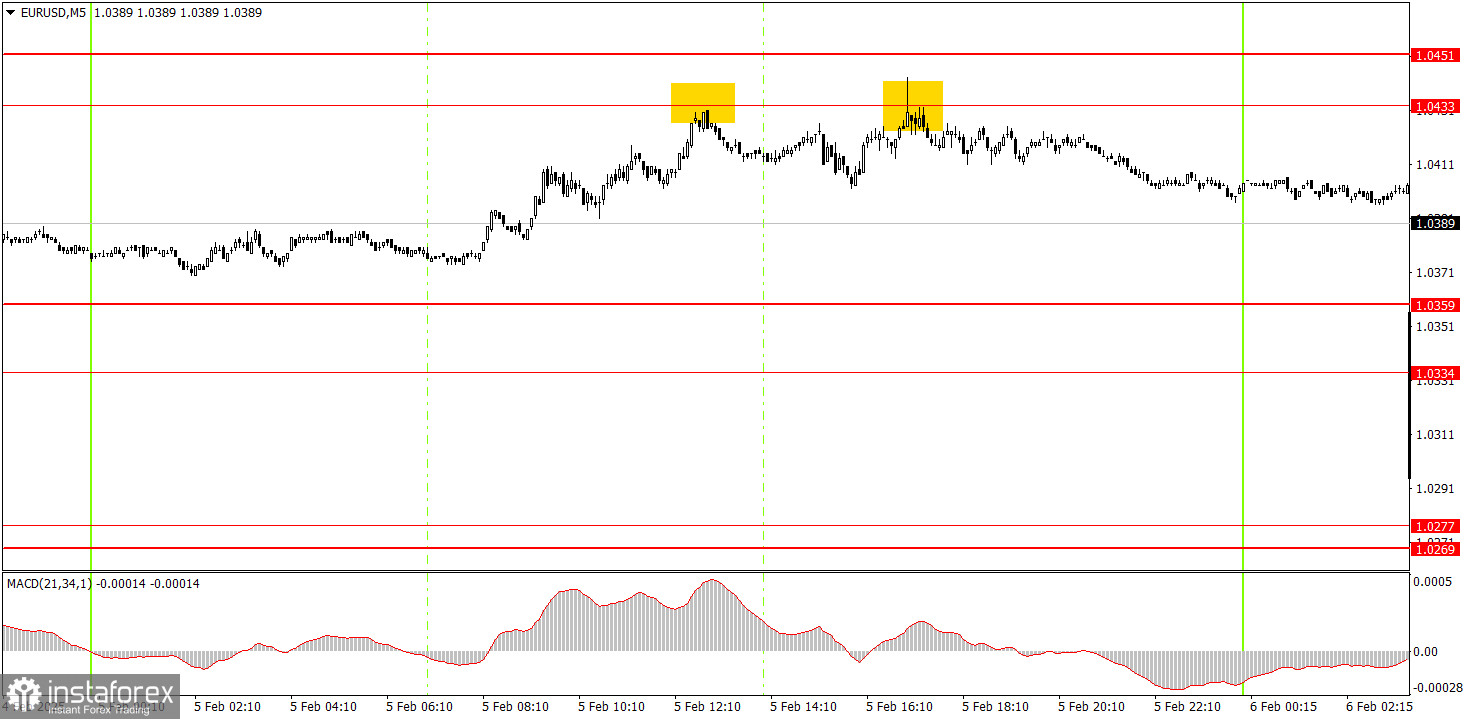
5M Chart of EUR/USD
On the 5-minute timeframe on Wednesday, two sell signals were generated. The price bounced twice around the 1.0433-1.0451 range. In the first instance, it dropped by just 17 pips, and in the second instance, the decline was a bit more significant. The first trade closed at breakeven (Stop Loss), while the second trade either yielded a small profit or could have been carried over to today.
Trading Strategy for Thursday:
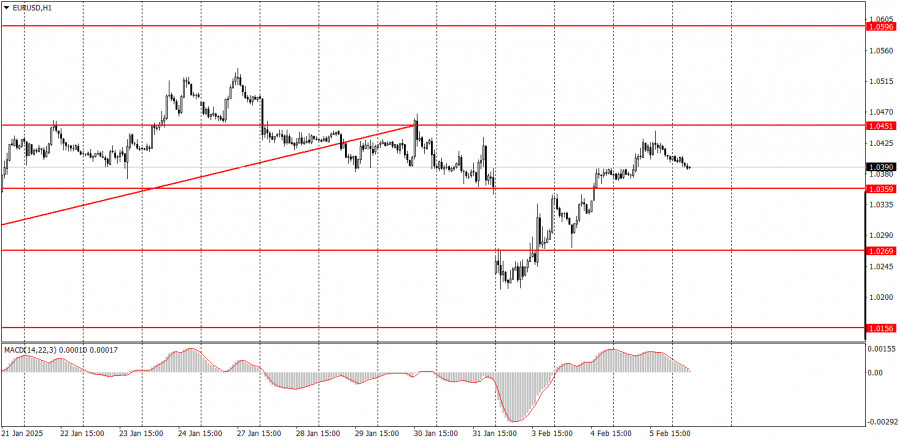
On the hourly timeframe, the EUR/USD pair is currently in a medium-term downtrend. Although the local uptrend was previously canceled, it has now resumed. A decline in the euro is still expected, as both fundamental and macroeconomic factors continue to favor the U.S. dollar. However, the upward correction on the daily timeframe may persist for several more weeks.
On Thursday, the pair may continue to rise, but trading decisions should be based on technical levels. The current increase in the euro is viewed as a correction on the higher timeframe. On the hourly chart, this situation can appear complex due to alternating trends.
On the 5-minute timeframe, the following levels should be considered: 1.0156, 1.0221, 1.0269–1.0277, 1.0334–1.0359, 1.0433–1.0451, 1.0526, 1.0596, 1.0678, 1.0726–1.0733, 1.0797–1.0804, and 1.0845–1.0851. On Thursday, the Eurozone retail sales report will be published, but it is unlikely to significantly impact the pair's movement. In the U.S., there will be an even less significant report on jobless claims. The Bank of England's meeting is expected to have a much greater influence on market movements.
Core Trading System Rules:
- Signal Strength: The shorter the time it takes for a signal to form (a rebound or breakout), the stronger the signal.
- False Signals: If two or more trades near a level result in false signals, subsequent signals from that level should be ignored.
- Flat Markets: In flat conditions, pairs may generate many false signals or none at all. It's better to stop trading at the first signs of a flat market.
- Trading Hours: Open trades between the start of the European session and the middle of the US session, then manually close all trades.
- MACD Signals: On the hourly timeframe, trade MACD signals only during periods of good volatility and a clear trend confirmed by trendlines or trend channels.
- Close Levels: If two levels are too close (5–20 pips apart), treat them as a support or resistance zone.
- Stop Loss: Set a Stop Loss to breakeven after the price moves 15 pips in the desired direction.
Key Chart Elements:
Support and Resistance Levels: These are target levels for opening or closing positions and can also serve as points for placing Take Profit orders.
Red Lines: Channels or trendlines indicating the current trend and the preferred direction for trading.
MACD Indicator (14,22,3): A histogram and signal line used as a supplementary source of trading signals.
Important Events and Reports: Found in the economic calendar, these can heavily influence price movements. Exercise caution or exit the market during their release to avoid sharp reversals.
Forex trading beginners should remember that not every trade will be profitable. Developing a clear strategy and practicing proper money management are essential for long-term trading success.